AuGR Agent Logs
How to locate AuGR Agent Logs
Log into the appropriate AuGR Tennent.
Navigate to Agents via the lower left hand menu.

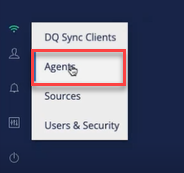
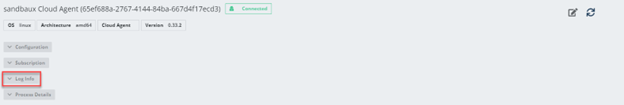
Locate the appropriate agent and click on Log Info carrot to drop down additional Log options.
Enable Logging
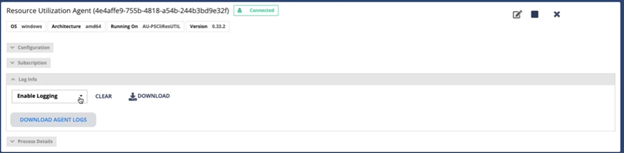
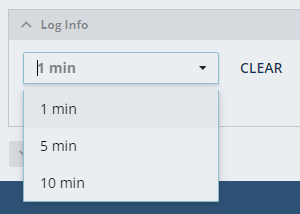
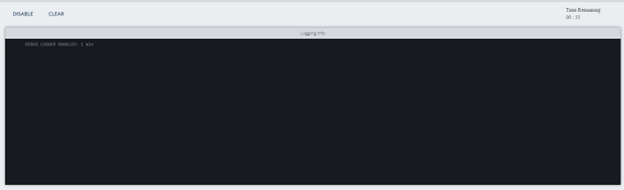
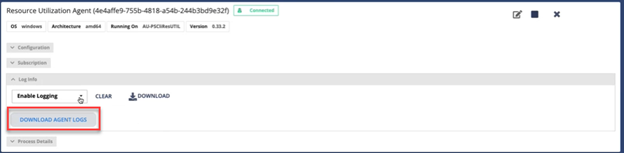
To review logs for all agent activity live, users can utilize the Enable Logging drop down and select 1, 5, or 10 min intervals to view logs for that time frame.
Once the desired time interval is selected a command window will open where users can watch the logs in real time.
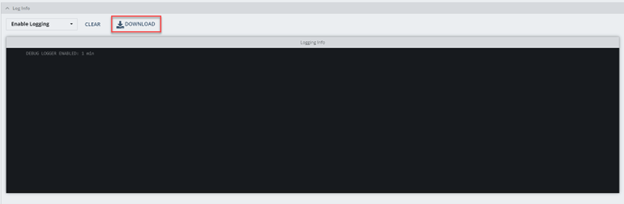
Once the logging is complete the Download button will appear allowing users to download the logs from their live enable logging session.
Log Leveling
Info : This log level is typically used for informational messages that highlight the progress of the AuGR Agent. It provides details that might be useful for understanding the flow of the agent but are not necessarily critical for debugging purposes. Informational messages might include agent startup/shutdown events, basic status updates, or important milestones.
Debug: Debug logging is more detailed and is used for debugging purposes. Debug messages provide users with detailed information about the internal workings of the AuGR Agent. They are used to track the flow of the program, the values of variables, and any other relevant information that can help identify and diagnose issues during troubleshooting. Debug messages are usually not enabled in production environments due to their verbosity and potential performance impact.
Tip: For troubleshooting agent issues change Logging Level to “debug” for more robust logs. Users MUST switch Logging Level back to “info” when troubleshooting is done. Leaving this configuration setting on debug will cause downstream resource issues.
Log Leveling Configuration
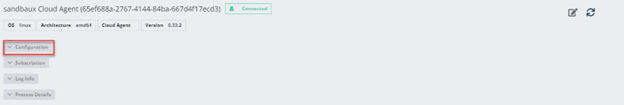
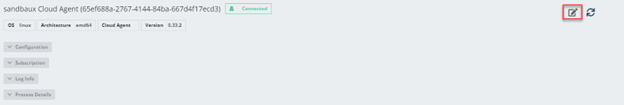
To identify the agent’s current Log Level configuration, use the Configuration carrot drop down.
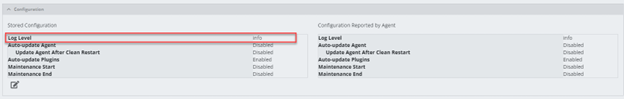
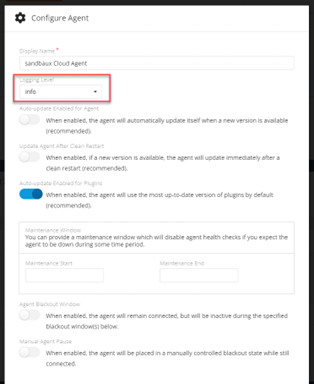
To reconfigure Logging Level users can “Edit Agent Configuration”
Using the Logging Level dropdown select “debug”
Downloading Agent Logs
To review logs from the past 7 calendar days users can click Download Agent Logs button.
Once a user downloads the logs a folder will appear in the users assigned downloads destination.
Reviewing Log Files
Once logs are downloaded, a folder will appear in the users downloads destination housing multiple files including:
- Pilot Log
- Parent Log
- Agent Logs
- Plugin Logs
Tip: Pilot Logs and Agent/Parent Logs house the most relevant information for users utilizing logs for troubleshooting agent issues.
Pilot Log
Pilot is a monitoring program that of sits over top of the agent itself and it checks for updates, agent connection status, and attempts to restore disconnected agents. In the Pilot logs users can find high level information about the overall agent performance and may even find meaningful error descriptions to assist in identifying an agent issue or at least identify a time stamp of when issues began to do further research in the Agent logs.
Tip: Pilot Logs open in notepad with the oldest date at the top of the file and the most recent information at the bottom. It is recommended to start at the bottom of the file and scroll up to begin the investigation.
Agent (Parent) Logs
In the Agent logs users can find more detailed information when troubleshooting agent issues. 7 separate agent files will appear in the user’s downloaded logs folder. The file with “parent.log” represents the current/most recent agent log. The remaining 6 will have the corresponding date included in their file name.
Agent logs monitor the overall agent performance.
Tip: Utilize Ctrl+f to search in the file for a specific date and time, or “error” to identify the section of the logs that will provide the most relevant information.
Reviewing Logs Best Practices
Interpreting agent logs involves understanding the information recorded by software agents, which are programs or scripts tasked with monitoring, collecting, and sometimes acting upon data within a system or network. Here's a general guide on how to interpret agent logs:
-
Understand the Log Format: Start by understanding the structure and format of the log files generated by the agent. This typically includes timestamps, event types, severity levels, and relevant data fields.
-
Identify Key Events: Look for key events or entries within the log file. These could include system startups, shutdowns, errors, warnings, user logins, file accesses, network connections, etc.
-
Timestamp Analysis: Pay attention to timestamps to understand when specific events occurred. This helps in identifying patterns, correlations, and sequences of events.
-
Severity Levels: Logs often include severity levels such as INFO, WARNING, ERROR, CRITICAL, etc. Understanding these levels helps prioritize issues based on their impact.
-
Error Messages: Focus on error messages or warnings as they indicate potential issues or anomalies within the system. Note the error codes or descriptions provided, as they can help in troubleshooting.
-
Contextual Information: Consider the context surrounding each log entry. This includes information about the system configuration, user activities, network environment, etc. Understanding the context helps in determining the significance of each event.
-
Correlation and Analysis: Look for correlations between different log entries or events. This could involve tracing the sequence of events leading up to a particular issue or identifying common patterns across multiple log files.
-
Filtering and Searching: Use filtering and search capabilities to narrow down the log entries based on specific criteria such as time range, event type, severity level, keywords, etc. This makes it easier to focus on relevant information.
-
Alerts and Notifications: Some agent logs may include alerts or notifications triggered based on predefined conditions or thresholds. Pay attention to these alerts as they often highlight critical issues requiring immediate attention.
By following these steps, you can effectively interpret agent logs to diagnose issues, monitor system health, and optimize performance within your environment.